
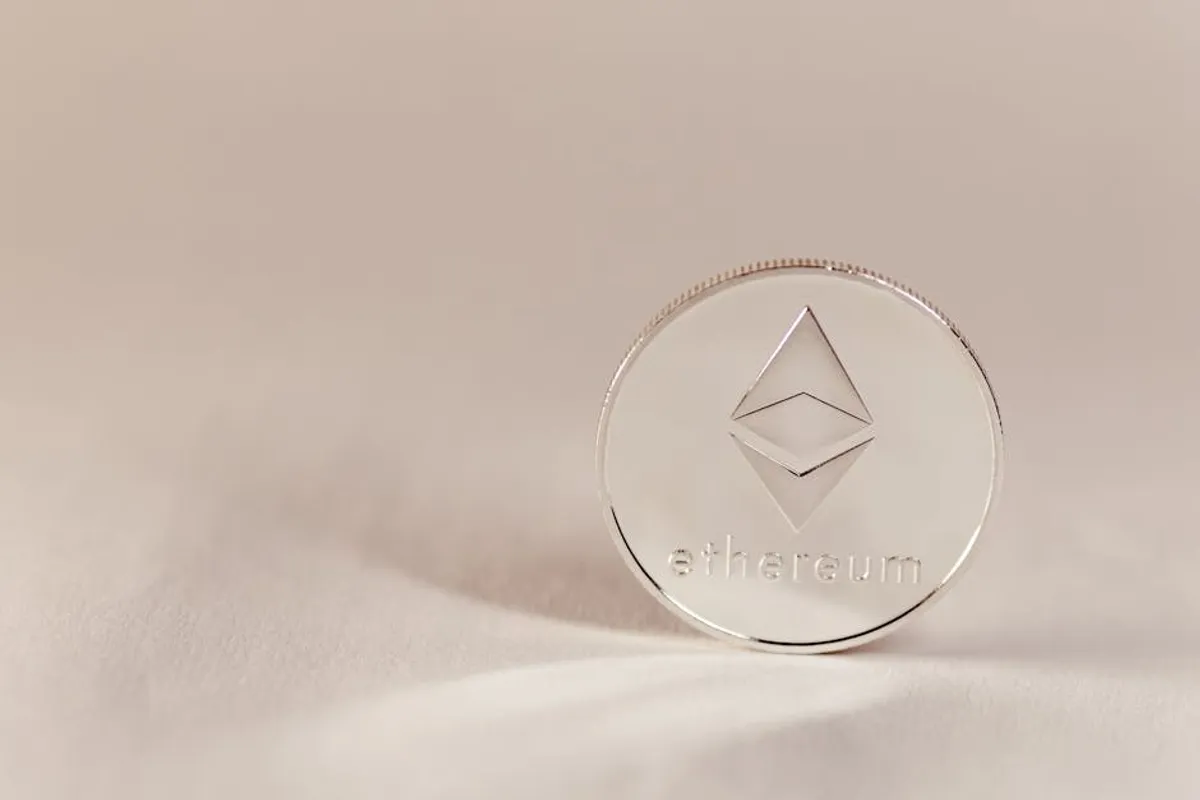
Navigating the volatile landscape of digital assets requires a data-driven approach, especially when considering an investment in Ethereum. Rather than relying on speculation or emotion, understanding how to systematically track Ethereum's price trends provides a foundational layer for more informed buying decisions. This involves dissecting various data points, from historical price movements to underlying network activity and broader market sentiment, to identify potential entry points and assess risk.
Understanding Key Price Trend Indicators
Effective price trend tracking for Ethereum begins with familiarizing oneself with the primary indicators that signal market direction and momentum. These indicators are not predictive in isolation, but collectively they paint a clearer picture of market dynamics.
- Price Action: The raw movement of Ethereum's price over time, represented through charts. This forms the basis for identifying trends (uptrends, downtrends, sideways) and key support/resistance levels.
- Volume: The number of Ethereum units traded within a specific period. High volume accompanying a price move lends credibility to that move, indicating strong conviction from market participants. Conversely, low volume on a price change might suggest a lack of significant interest.
- Market Capitalization: The total value of all Ethereum coins in circulation (price per coin multiplied by circulating supply). This metric provides a sense of Ethereum's overall market dominance and scale within the broader cryptocurrency ecosystem.
- Volatility: The degree of variation of a trading price series over time. High volatility means prices can change dramatically over short periods, presenting both opportunities and risks. Tracking volatility helps gauge the potential for rapid price swings.
- Dominance: Ethereum's market capitalization as a percentage of the total cryptocurrency market capitalization. Changes in dominance can signal shifts in investor preference between Bitcoin, Ethereum, and other altcoins.
Leveraging Technical Analysis for Entry and Exit Points
Technical analysis involves studying past market data, primarily price and volume, to identify patterns and predict future price movements. For Ethereum, this means interpreting chart formations and applying various indicators to gauge market psychology and potential turning points.
Candlestick Patterns and Chart Formations
Candlestick charts provide a visual representation of price action, showing opening, closing, high, and low prices for specific timeframes. Recurring patterns within these candlesticks can signal potential trend continuations or reversals. Examples include:
Bullish Patterns: Hammer, bullish engulfing, morning star, indicating potential upward price movement.
Bearish Patterns: Hanging man, bearish engulfing, evening star, suggesting potential downward pressure.
Beyond individual candlesticks, larger chart formations emerge over time, such as head and shoulders (often a reversal pattern), triangles (continuation or reversal), and flags/pennants (continuation patterns). Recognizing these formations requires consistent observation and understanding of their typical implications for price direction.
Moving Averages and Oscillators
Moving averages smooth out price data to identify the direction of a trend. Simple Moving Averages (SMA) and Exponential Moving Averages (EMA) are commonly used, with EMAs giving more weight to recent prices. Crossovers of different moving averages (e.g., a short-term MA crossing above a long-term MA) can act as buy or sell signals. For instance, the 50-day EMA crossing above the 200-day EMA (a "golden cross") is often seen as a bullish signal.
Oscillators are momentum indicators that fluctuate between set ranges, helping to identify overbought or oversold conditions. The Relative Strength Index (RSI) and Stochastic Oscillator are prominent examples. An RSI above 70 might indicate Ethereum is overbought and due for a correction, while an RSI below 30 could suggest it is oversold and potentially undervalued in the short term. These tools provide context for price action, signaling when a trend might be losing momentum or poised for a reversal.
Pro Tip: No single technical indicator guarantees future price movements. Always use a combination of indicators and timeframes to confirm signals. Over-reliance on one metric can lead to misinterpretations and poor decisions. The goal is to build confluence, where multiple indicators align to support a specific market outlook.
Evaluating Fundamental and On-Chain Data
While technical analysis focuses on price charts, fundamental and on-chain analysis delves into the intrinsic value and underlying activity of the Ethereum network. These data points offer insights into the health, utility, and adoption of the blockchain.
Network Activity and Development Milestones
Tracking the number of active addresses, daily transactions, and transaction fees on the Ethereum network provides a measure of its usage and demand. A growing number of active users and transactions suggests increasing utility and adoption, which can positively influence long-term price trends. Conversely, declining network activity might signal reduced interest or competition from other platforms.
Significant development milestones, such as major protocol upgrades (e.g., the Merge, sharding implementations), can drastically impact Ethereum's perceived value and future potential. Monitoring the Ethereum Foundation's roadmap, developer activity on GitHub, and community sentiment around these developments offers crucial insights into the network's evolution and potential for growth.
Supply, Demand, and Exchange Flows
Understanding the supply dynamics of Ethereum is critical. This includes tracking the total circulating supply, inflation rate, and the impact of mechanisms like EIP-1559 (which burns a portion of transaction fees, potentially making Ethereum deflationary under certain conditions). Reduced net supply, combined with increasing demand, creates upward price pressure.
Monitoring exchange inflows and outflows indicates investor sentiment. Large inflows of Ethereum to exchanges might suggest increased selling pressure, as investors move assets to trade. Conversely, significant outflows from exchanges to personal wallets or decentralized finance (DeFi) protocols can signal a long-term holding intention or greater utility, reducing immediate selling pressure.
Monitoring Market Sentiment and News Flow
The cryptocurrency market is heavily influenced by sentiment and news. Tracking public perception and significant events can provide an edge in understanding short-term price movements and broader market shifts.
Social media trends, mentions of Ethereum on platforms like X (formerly Twitter) and Reddit, and sentiment analysis tools can offer a real-time pulse of public opinion. While often speculative, strong positive or negative sentiment can amplify price trends. Furthermore, major news events—regulatory announcements, institutional adoption, hacks, or macroeconomic shifts—can trigger rapid price changes. Staying abreast of global economic indicators, central bank policies, and general financial market health is also relevant, as these factors often correlate with cryptocurrency market performance.
Building Your Ethereum Trend Tracking Framework
Developing a robust framework for tracking Ethereum price trends involves integrating multiple data sources and analytical approaches. Begin by establishing clear objectives for your investment, whether short-term trading or long-term accumulation. Then, select a combination of technical, fundamental, and sentiment indicators that align with your strategy. Regularly review your chosen metrics, adapting your approach as market conditions evolve. The goal is to develop a systematic process that reduces emotional decision-making and enhances the probability of making informed, strategic purchases.
Frequently Asked Questions
What is the most reliable indicator for Ethereum price trends?
There is no single "most reliable" indicator. Effective trend analysis for Ethereum involves combining multiple indicators from technical, fundamental, and on-chain analysis to build a comprehensive view and confirm signals. Relying on a single data point can lead to incomplete or misleading conclusions.
How often should I check Ethereum price trends before buying?
The frequency depends on your investment strategy. For short-term trading, daily or even hourly monitoring of charts and news might be necessary. For long-term accumulation, weekly or monthly reviews of fundamental and on-chain metrics, alongside major news, might suffice. Consistent, but not obsessive, tracking is key.
Are historical Ethereum price trends predictive of future movements?
Historical price trends and patterns can offer insights into potential future movements by illustrating past market reactions to certain conditions. However, they are not direct predictors. The cryptocurrency market is dynamic, and past performance does not guarantee future results. Trends indicate probabilities, not certainties.
What role does global economic news play in Ethereum prices?
Global economic news, such as inflation rates, interest rate changes, geopolitical events, and overall market sentiment in traditional finance, can significantly influence Ethereum prices. As a risk-on asset, Ethereum often reacts to macroeconomic shifts, sometimes moving in correlation with or inversely to traditional markets.